Previewing the IDE of the Future — Fleet
JetBrains recently released a preview version of their newest IDE, Fleet. Let’s take a look at it
by Percy Bolmér, October 21, 2022

I’ve been waiting a long time for JetBrains to release their new product Fleet. Quiet frankly, I’ve always found JetBrains products to be much more powerful than their competitors, but also very expensive for a good reason.
The IDE is one of the developer’s most important tooling; it is where we spend most of our time, and it is important to have a good tool.
I am a frequent Go developer, and GoLand always struck me as the most powerful editor.
So you might think I would be using Goland? I do have a license provided by my gracious employer, but I can’t stand using it. The UI looks so old and confusing that I can’t live with it. There are so many buttons, and everything is hidden behind some menu.
I have been super excited about Fleet however, imagine the power of IntelliJ’s products but with a nicer UI. That caught my eye. I know they can provide powerful products, but I would be sold if they could manage a better UI.
The product is still unfinished and has been in closed Beta for a while, but they recently released a public Preview. Let us download it and give it a spin!
You can use Fleet after downloading it on their website for free now during the preview.
To install it, you will need their software management application named Toolbox. Once you start the toolbox, you can find Fleet at the top for preview, which allows you to download it.
In this article, we will be exploring Fleet on a Go code base. The code can be found on my GitHub.
Previewing and Navigating the Code
The first screen that hits us is the workspace selection screen. In it, we can see the currently supported connection types.
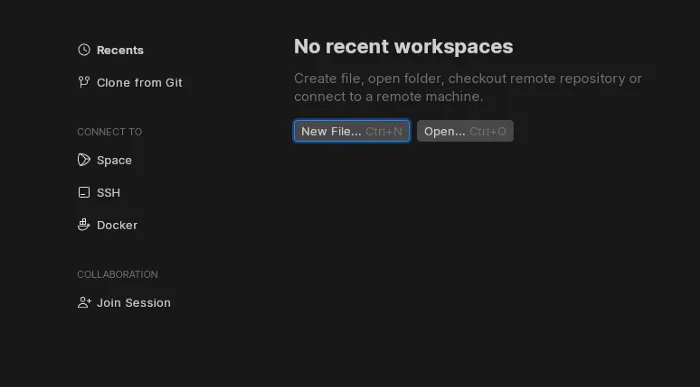
Fleet makes it easy to use either file on your local computer, Space,Docker, or SSH into a remote server. This is quite a nice feature to have off the bat. With VS Code, I rely on a Remote Extension to make this possible.
To try this out, I will Clone from Git to pull home a GitHub Repository of a WebSocket API I have on GitHub.This was easy enough by entering a URL to the repository and the location on my computer to store it.
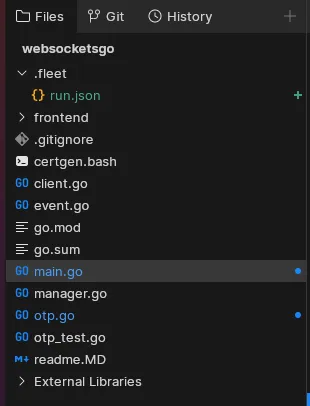
Once it is completed, Fleet shows us the files. The UI is very similar to VSCode, with all the files in a sidebar.
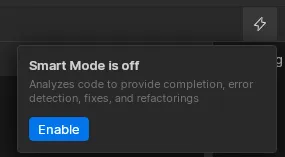
One interesting thing is that Fleet asks us to enable Smart Mode.Smart Mode will analyze the code base in the current workspace and enable syntax highlighting, autocompletion, error detection, and enable refactoring related to the language inside the files. All the general features that you want from your IDE. We will certainly want this, and having to enable it by default is a bit strange.
It takes a few seconds for the enabling to run, but once done, we can see the code having syntax highlighting.
I assume it is possible to disable smart mode when you want to open up a giant code base and don’t want to crash your computer
The first thing I notice is the Usage highlights which I find cool.
Above my Event struct, I can see a small notice that the struct is being used in seven locations in my code base, and of course, I can also view the code references by clicking on the Highlight.

That is a nice feature.
One feature I find nice in other IntelliJ products is their GoTo search screen. It is a screen that allows you to free text search your code base and open the file at a given location. Luckily they have included that goto screen in Fleet.
The following Gist shows you how I use it to search for the declaration of RetentionMap in the code base to find and locate the specific location it is declared. To bring up the goto search, we can use ctrl+K. Once the menu appears, we can search for words and their references.
The search screen is nice. It shows us multiple hits and some code preview for each hit to navigate between them easily.
Interface Implementations and Usage Highlights
In the code base, I have a RetentionMap which throws away old passwords based on a timer, a simple one-time password (OTP) solution. I want to have an interface named verifier that can have a single method with the signature VerifyOTP(otp string) bool.This is meaningless for now. It is just to test writing some code and see how it handles the interface implementations and code suggestions.
The actual code suggestions in the gif are pretty limited, but the highlight is that this interface is implemented by one struct, and the ability to jump to the implementation is nice.
You can see that the RetentionMap also lists 1 super after writing the interface, this is a list of all the interfaces that the struct is fulfilling, which is nice when navigating large code bases with many interfaces.
So there are some nice features in the editor by default. The looks are also rather interesting, with the small highlight summaries appearing above structs and interfaces, etc. This also goes for variables and consts. It is really easy to navigate between their usages.
Let us write some code that we can use to debug the VerifyOTP implementation since debugging is probably the most important feature of an IDE, in my opinion, apart from code suggestions.
Writing Code and Debugging and Testing
The code that we will test is rather simple, RetentionMap is a map storing string values, and after a given period, they are deleted.
We will write a unit test for this functionality to make sure it works. I open otp_test.go which is the file I will update.
After I’ve typed func TestOTP Fleet recommends an automatically named unit test named TestRetentionMap_VerifyOTP,which is exactly what I want. It then generates the function signature of a unit test, which is nice.
When writing the unit test, we can see one cool feature I miss in VS Code. Whenever I type a function name, Fleet will give me a popup that kinda floats next to my cursor, with code suggestions such as function names that match my pattern, their input parameters, etc.

I Say I miss this feature in VS Code, but this exists, but no with the input parameters displayed.
Once the Unit test is completed, we can execute the test in two modes: Run mode and Debug mode. These modes are found by a nice little play button next to the unit test.

Run will simply execute the test and print the result in a new terminal. Debug will allow us to attach breakpoints and use dlv to view the current application state.
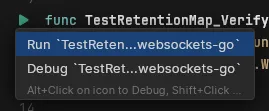
If I select Run, we will be presented with the unit test logs and output in a new terminal at the bottom (similar to VS Code).
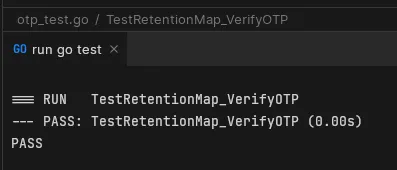
Debugging is something I love, so let’s try that.

So it seems the installation does not yield the correct permissions. I will go ahead and report that to them. The Fleet team maintains a YouTrack to which we can report bugs.
My bug is submitted Here
We can easily fix this if we list the permissions of the DLV binary using the path in the logs; it is missing execute permissions.
chmod +x /home/percy/.local/share/JetBrains/Toolbox/apps/Fleet/ch-0/1.9.237/backend/plugins/go/lib/dlv/linux/dlvLet us try debugging again. I’ve set a breakpoint on the line where I verify the OTP. A new display will show up in Fleet with the debugging information.
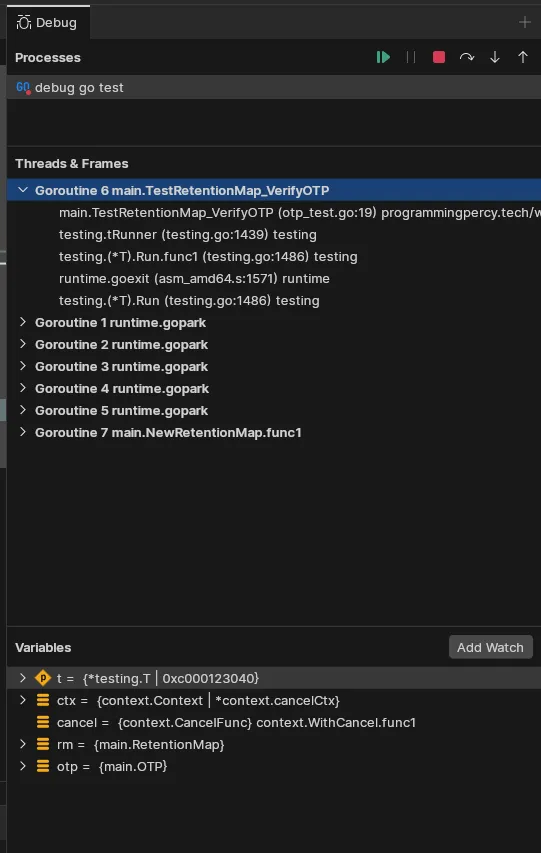
And the first thing that strikes me is that it lists all the goroutines. In this view, we can jump between them and inspect the current state of all currently running processes.
As you can see, we can easily also display the Variables that exist in the current scope of the breakpoint.
We can easily navigate the code by stepping over (going to the next line), step into which goes into the function being called, allowing you to debug nested function calls while trying to detect any bugs. We can also step out, finish the current function we are in, and move out into the parent that called it.
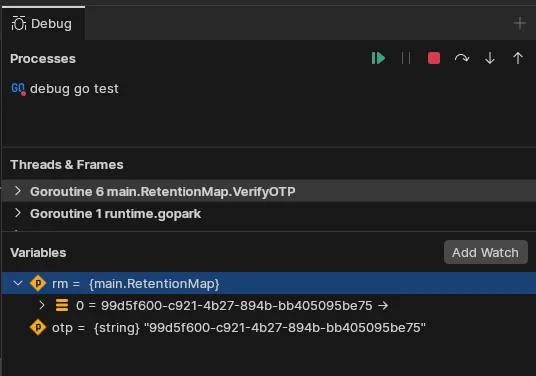
Overall the debugging seems to be a very pleasant experience in Fleet. So we made changes in the code, we have a repository to push these changes to, so let’s explore the source control integration in Fleet.
Source Control Integration
One really important thing for an IDE is that it should help us integrate Git or any other supported version control system. Let us explore how this looks inside Fleet. We have made some changes in a few files. Let us see if we can view these and push them. Any files changed are marked with blue text and a blue dot to highlight that they contain changes since the last commit.
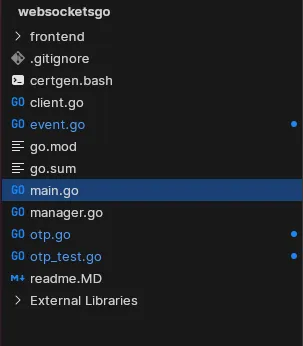
We can view any additions marked by a green line inside the files.

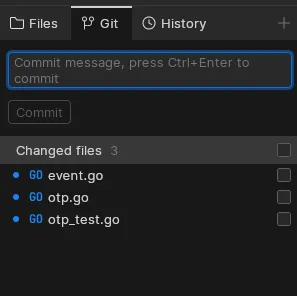
There is also a tab named Git that displays changed files and also allows us to make a new commit.
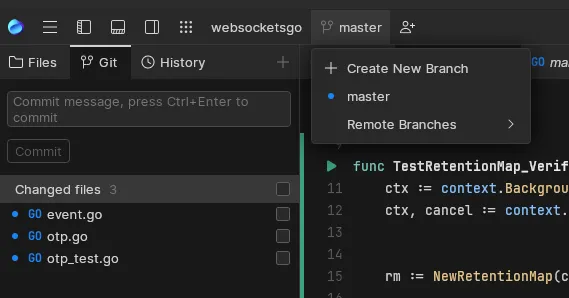
Before we commit, let’s see if we can make a new branch, so we don’t commit anything to the master. If we have source control enabled, you can see the current branch that you are working on at the top menu, and clicking it allows us to fast and easily create a new branch from the current branch.
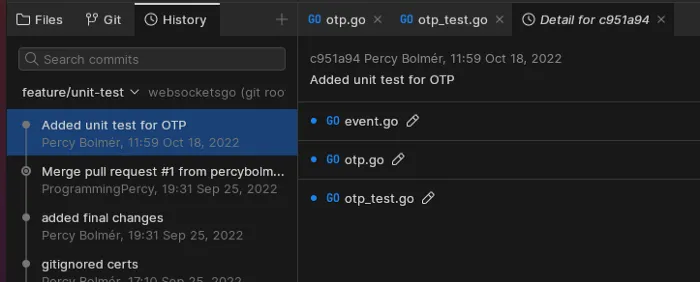
Once a new branch is created, it will change to that branch. After committing the changes, we can navigate to the History tab which shows the git log in a very nice graphic, and each commit can be viewed to see the changes.
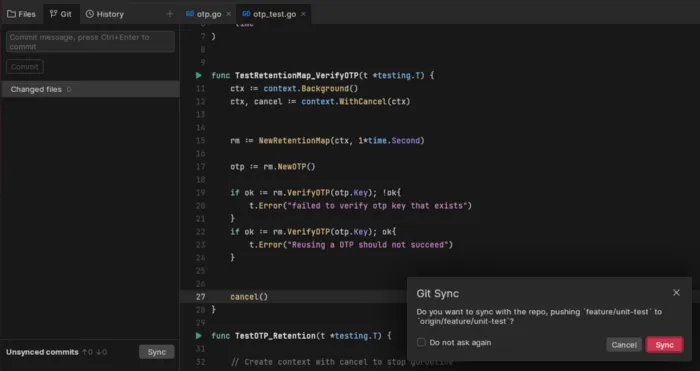
Once done, we can push it by using Sync, which will pull and push any changes done on the repository.
If it is the first time you use Git for that account, it will ask you to provide your GitHub token. If you press the Generate button, it will even bring up GitHub for you to the correct place, which was nice.
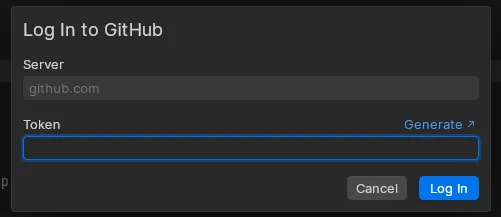
After pasting the token in, we are connected to GitHub. That was easy, and no extra plugin was needed.
Actions and Run Configurations
Another feature that we are going to explore is the execution of the program using the editor. This is useful when we want to run an application and attach debuggers.
As you imagine, to attach our breakpoints and other things, we need to execute the application from the IDE. With the unit tests, we could easily do that by pressing a play button, but it may become more complex for an application.
You might have built a CLI and want different arguments passed in, or maybe some certain environment variables.
So, let us look at the Run configurations used to handle this.
Pressing CTRL+SHIFT+K brings up the Action panel, which has a bunch of Actions that can be run.
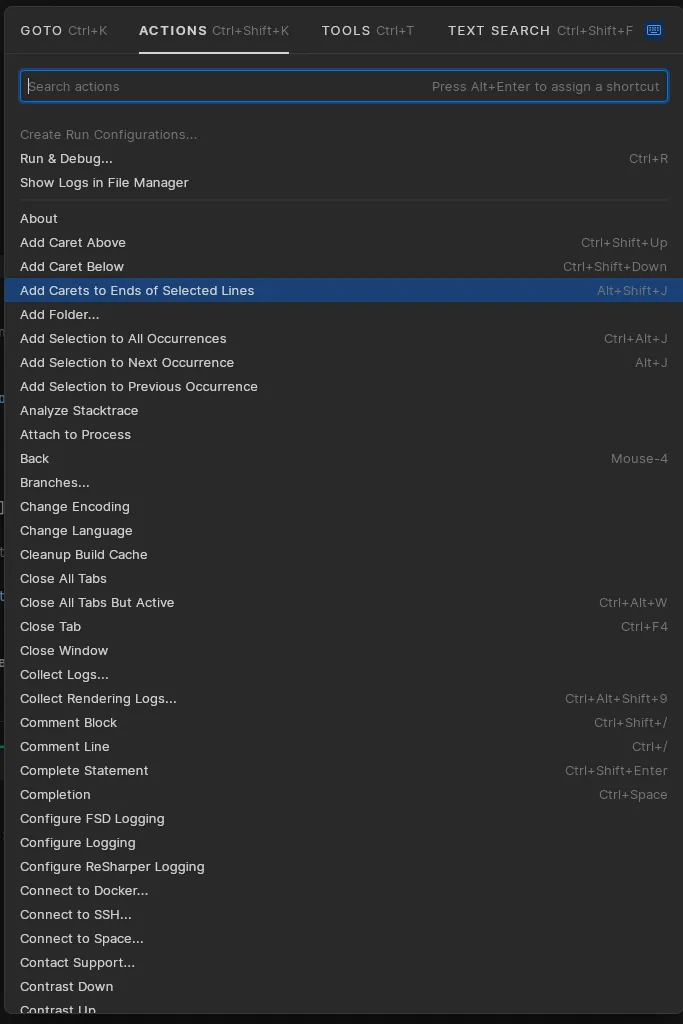
Actions are like small macros that help you perform certain tasks by hotkey instead of doing them repeatedly.
One particular action that we will try is the Create Run Configurations.This helps us generate a configuration file that enables us to run our applications the way we want.
The command will start a wizard to set up the configuration, helping you with each step.
In the gist, you see me add a print statement to print an environment variable and place a debugger. I then generate a new configuration and set the environment variable to a certain value, and using CTRL+R we can bring up the Run tab, which lists all the configurations we have present and allows us to run them.
As you can see, the editor runs the application, breakpoints are respected, and we can review the application state.
In the example, there is a bug. The environment variable printed is not shown. I have also reported this to the guys at Fleet here.
Run actions and run configurations are super cool and powerful. This is not a new feature; it exists in almost all IntelliJ products. VS Code has them named as debug configurations.
Collaboration
One cool feature of Fleet is built-in session sharing and collaboration for code bases.
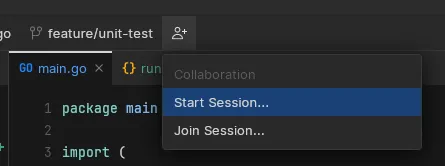
If you face a problem and want help from colleagues or friends, you can simply start a new collaboration session by pressing the user icon in the top menu. This will copy a link that you can send to anyone who has fleet installed, and once they click that link, it will open up a fleet instance with your code, and they can edit it, and you can see what happens live.
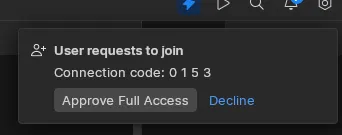
Once somebody with the link tries to join, you will get a small pop-up asking you to allow them.
The users can now work on the same files at the same time. This feature is cool because this is just not a mirror between the host and client. The client can work on a different file while the host works on another file.
It is just a shared session where we can collaborate.
In the gist, you can see me having main.go open while the colleague updates otp.go.We can then jump to the colleague’s current working location by pressing their icon. That is amazing!
Another insane thing is the collaborators can even trigger actions based on the host configuration.
Remember how we created a run-server configuration before, look at my host editor as the collaborator triggers that run for us, the same way we would have by running CTRL+R and selecting it.
We share terminal and run outputs, and this goes for all collaborators.
Conclusion
I am going to be honest. I was impressed with the debugger; it felt smoother and showed variables values much more clearly than VS Code which I am used to.
What surprised me the most was that it displayed all the Goroutines, which I felt was a big deal. I had to go back to VS Code and check if this was possible, and it is. It is just more hidden, and for that reason, I’ve missed that before. So I’ve now found a very nice new feature in VS Code, thanks to Fleet.
The built-in session sharing feels like it can become a huge thing as well. I know there are plugins, etc., for VS Code for remote collaboration, which also are cool, but again, everyone needs to install a plugin, etc. It just feels a lot smoother if it is built in. Will I make the switch to Fleet?
Not yet. I want plugins to arrive and allow the editor to grow some first. I know everything can be built in from the get-go, and having extensions as plugins is amazing and can help everyone make their IDE their flavor.
I also feel like this small test I made presented two bugs. I know it is a preview, but there are probably many other bugs. I will let the fleet mature a bit before trying it on full-time. I do like some parts of it. IntelliJ products have strong suggestions engines and other parts that I find a bit lacking in VS Code.
But I am going to be honest, it feels like a VS Code rip-off — the design and placement of things are 95% a rip-off from VS Code.
However, what if we had a nice UI like VS Code and the power of IntelliJ products behind one editor?
Well, I guess that is what Fleet might become in the future.
Feel free to reach out to me in any of my social media listed below.
If you enjoyed my writing, please support future articles by buying me an Coffee